My Maps
My maps is the toolset that is part of the advanced tab, my maps enables you to create graphics on the map with the ability to style and edit the graphics.
Available graphic types are point, line, polyline, polygon, circle, rectangle, arrow and text. Graphics can be added, edited, and deleted from within the my map area of the interactive map window.
To add a graphic to the map:
- Click the button of the type of graphic you would like

- Follow the draw instructions beside the mouse cursor
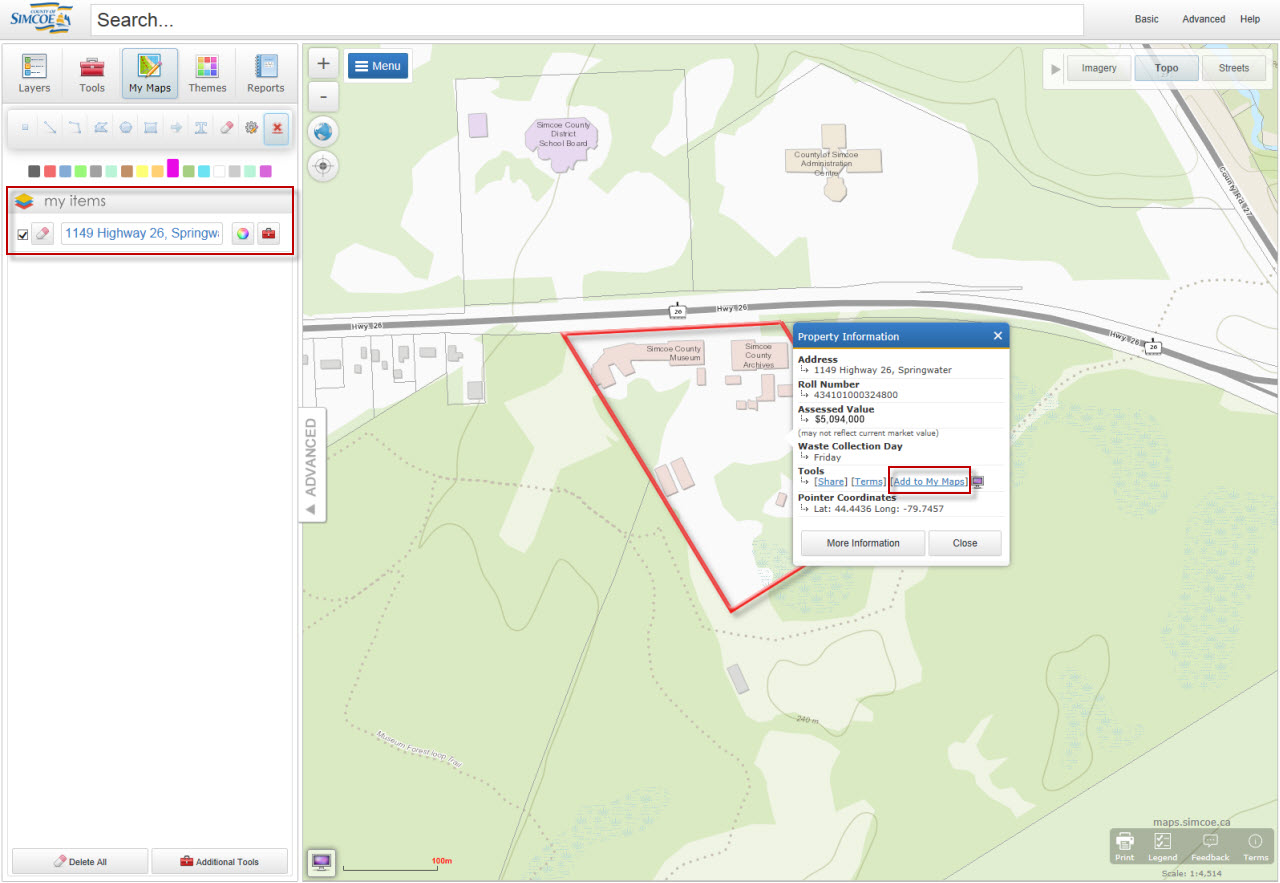
To add a property to the map as a graphic:
- Click the parcel you would like to make a graphic
- Select the ‘Add to My Map’ button in the property information callout box
- This will add the parcel to the my items table of contents

Each graphic appears as an item in your my items table of contents and provides access to a variety of editing tools for each specific item. Operations which can be completed are visibility, deletion, label editing/visibility, geometry editing tools, and buffers.
To turn on and off the visibility of a graphic:
- Click the check box beside the graphic
- Checked box - the graphic is visible

- Unchecked box – the graphic is not visible

To delete a graphic:
- Click the eraser beside the graphic you would like to delete.

To edit the label of the graphic:
- Doubling click the text label in the my maps table of contents
- Type your custom label
- Clicking the feature will allow you to toggle on and off the visibility of the label using the show label checkbox

To edit a graphic:
- Go to the tools for the specific graphic
- Go to edit tools

- Select the tool you want to use to modify the graphic
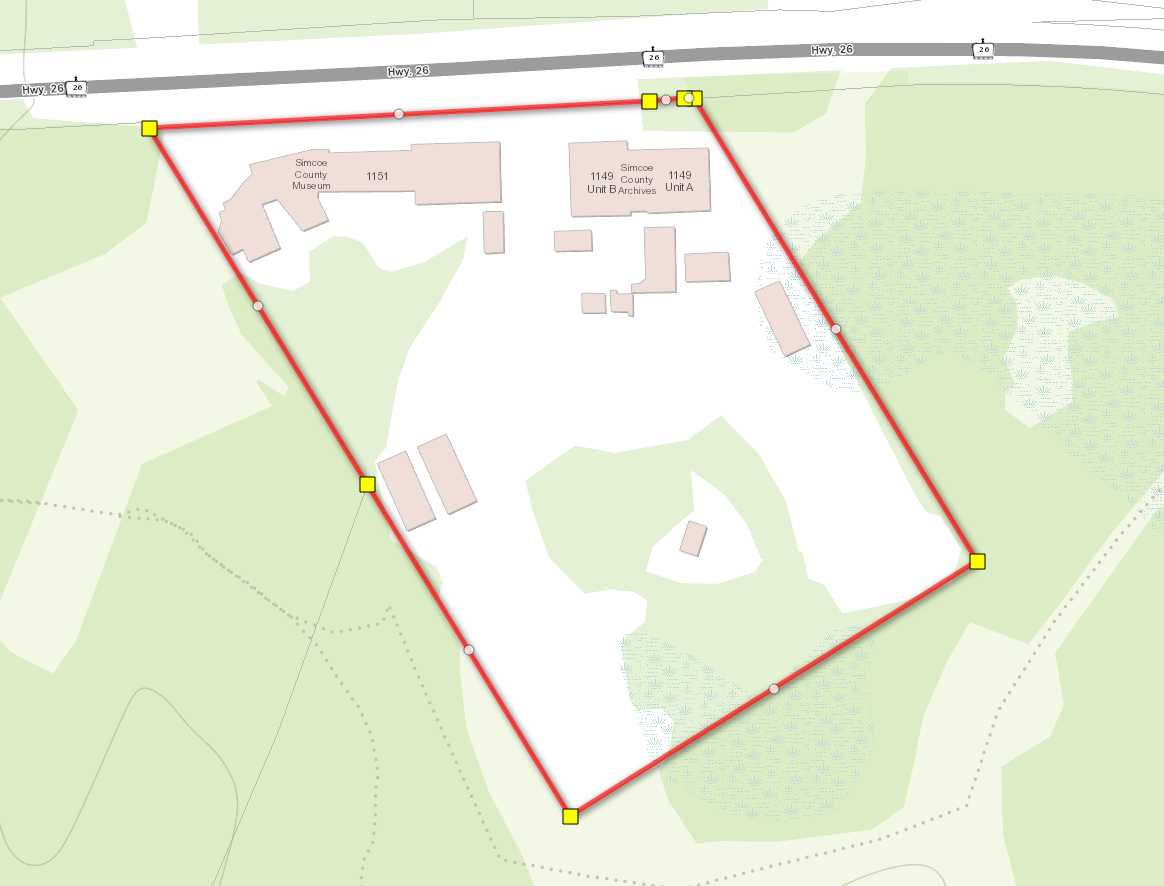
To add a vertex to a graphic:
- Click the vertices only edit tool

- Click and drag the white point of a graphic
To delete a graphic’s vertex:
- Click the vertices only edit tool
- Right click on the vertex to be deleted
- Select delete vertex

Tools specific to a graphic can be accessed from the tools dropdown menu. The drawing options and delete tools can also be accessed from this menu.

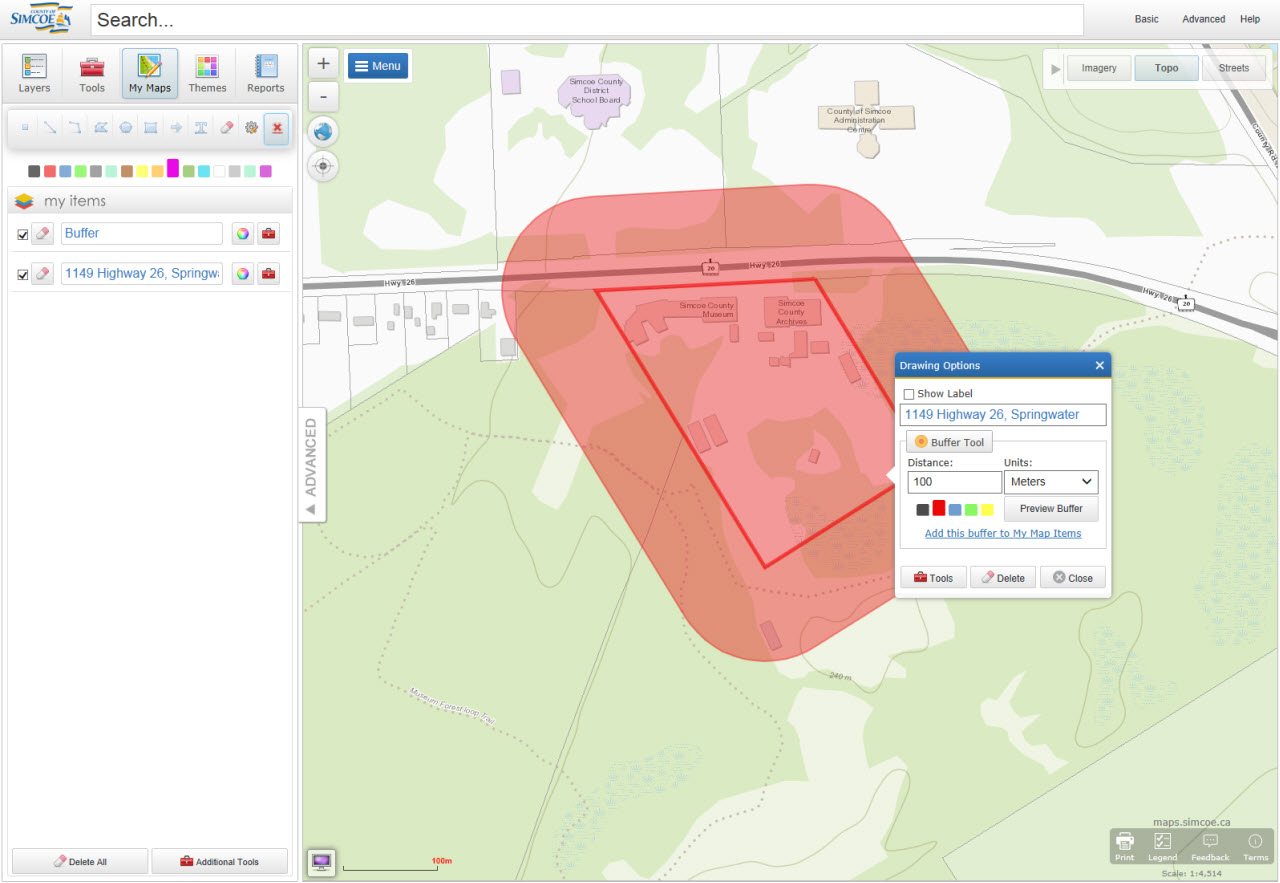
To create a buffer around a graphic:
- Select the ‘Buffer Area’ tool from the toolbox dropdown menu of the graphic

- Enter a distance for the buffer
- Select the units of the buffer
- Choose a colour
- Click ‘Preview Buffer’

- You can change the buffer details and preview again or click the ‘Add this buffer to My Maps Items’ link below the preview buffer to permanently add the buffer as a new graphic in the map

Delete All:
Delete All at the bottom of the my maps tab allows you to delete all of your graphics at once
Additional Tools:
Some additional tools are available at the bottom of the my maps tab:
-
Show all or hide all allow you to check/uncheck all of the graphics you currently have in your my items.
-
Delete selected (checked graphics), delete unselected (unchecked graphics), or delete all allows you delete multiple graphics at a time.
-
Show points only, show lines only, or show polygons only allows you to only show graphics of that specific desired type.
-
Zoom to selected (checked graphics) allows you to zoom to graphics that you have checked off in your my items.
Adjust my Map Settings:

- The 'Lock Drawing Tool' allows you to create drawing after drawing without having to reselect the graphic you are wanting to draw.
- The 'Use Freehand Drawing Tool (Line & Polygon)' allows you to hold down the left mouse button when creating a line or polygon and drag the mouse to create a drawing that represents where the mouse was dragged from start to finish.